Overview
The Data Visualizer allows users to view a bitmap representation of
their document contents to help identify patterns within their data.
By selecting or creating different color palettes users can quickly
identify text sequences within binary data, patterns and repeating data,
tables, and even palette-based images.
Default Palettes
Each Data Visualizer palette maps each byte of a document to a specific
color.
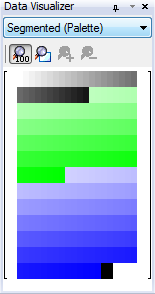
Segmented
|
|
The segmented palette displays bands of colors based on the byte value
of the data. The palette is organized by color
bands to help visually separate control, ASCII, and extended ASCII characters.
|
Range |
Color / Description |
|
[ 0 .. 31] |
Grey scale; ASCII Control characters |
|
[ 32 .. 127
] |
Green; ASCII characters |
|
[ 127 .. 254
] |
Blue; Extended ASCII characters |
|
[ 255 ] |
Black |
|
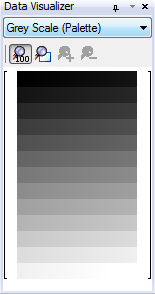
Grey Scale
|
|
The grey scale palette maps each character to its grey scale RGB value.
For example, <byte> becomes RGB(<byte>, <byte>, <byte>).
All 0x00 values are rendered as black and all 0xFF values are rendered
as white. |
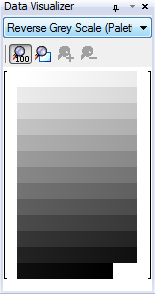
Reverse Grey Scale
|
|
The reverse grey reverses the palette order of the grey scale palette.
For example, <byte> becomes RGB(255-<byte>, 255-<byte>,
255-<byte>).
All 0x00 values are rendered as white and all 0xFF values are rendered
as black. |
Custom Palettes
Hex Workshop processes the standard Microsoft(tm) .pal file format (RIFF
format with PAL information in the palette information in the DATA chunk).
The palettes must contain exactly 256 colors. Hex
Workshop will output error information in the Output
Results Window if unable to parse a palette file.
Users can create custom palettes using a graphic software package or
by hand. Hex Workshop provides a palette structure
viewer library (pal.hsl) to aid in palette design.
By default, palette files should be placed in <Install Directory>\Palettes
(e.g. C:\Program Files\BreakPoint Software\Hex Workshop v6.5\Palettes).
Alternatively, users can change the default palette
directory through the Paths
Configuration Preferences.
Hex Workshop must be restarted to load new palette files.
Position Brackets
The Data Visualizer draws thin brackets around the visualization bitmap
to indicate where the editor data resides in the bitmap.
Set Editor Caret Position and Selection
Mouse-Over location
When users move the mouse over the visualizer bitmap, the cursor position
displayed in the Status Bar is updated
to show the offset within the document.
Clicking within the Visualizer Bitmap
Pressing the left mouse button while on the Visualizer bitmap will set
the caret position within the editor window.
Selecting within the Visualizer Bitmap
Users can select data within the Visualizer Bitmap (and editor) by either:
Pressing the left mouse button and dragging the mouse
pointer to the ending location.
Pressing the left mouse button to set the start location
and holding the shift key while pressing the left mouse button to select
the ending position.
Both selection methods will update the selection indicator in the Status Bar.
Manipulation
 Zoom to Editor
View
Zoom to Editor
View
The Zoom to Editor View feature synchronizes the Data Visualizer view
to match the column width and page width of the editor. When
synchronizing with the editor view all of the scrolling and column width
adjustment features are disabled. Zooming in or
out automatically disables the Zoom to Editor View.
 Zoom to Doc
The Zoom to Doc features zooms out to view as much of the document as
possible. Zooming does not adjust row length (number
of bytes displayed per row). To adjust the row
length, see Increase Row Length, Decrease Row Length, or Set Row Length
features.
 Zoom In (Keyboard:
'+')
Zoom In (Keyboard:
'+')
Zoom in decreases the height of the Visualizer boxes.
 Zoom Out (Keyboard:
'-')
Zoom Out (Keyboard:
'-')
Zoom out increases the height of the Visualizer boxes.
Match Editor Row Length (Keyboard: <space>)
Set the Visualizer row length to match the editor row length. The
number of bytes displayed per row will automatically adjust as the editor
view is adjusted by sizing or through the General
Display Options Preferences.
Increase Row Length (Keyboard: <right arrow>)
Increases the number of bytes displayed per row in the Visualizer. The
maximum number of rows displayed is limited by the width of the Data Visualizer
window. Increase the window size by dragging the
window frame to allow for larger row lengths.
Decrease Row Length (Keyboard: <left arrow>
Decreases the number of bytes displayed per row in the Visualizer.
Set Row Length
Defines a specific row length. The row length
will be reset if the window is sized smaller than the designated row length.
Refresh (Keyboard: F5)
Forces a repaint of the Data Visualizer.
Keyboard Shortcuts:
All keyboard shortcuts require that focus be set to the Data Visualizer
by clicking within the Data Visualizer Window.
|
Key |
Description |
|
Home |
Scroll to top of Visualizer View (not applicable
when Zoomed to Editor View) |
|
End |
Scroll to end of Visualizer View (not applicable
when Zoomed to Editor View) |
|
Page Up |
Scroll up one page within Visualizer View (not
applicable when Zoomed to Editor View) |
|
Page Down |
Scroll down one page within Visualizer View
(not applicable when Zoomed to Editor View) |
|
Up Arrow |
Scroll up one line within Visualizer View (not
applicable when Zoomed to Editor View) |
|
Down Arrow |
Scroll down one line within Visualizer View
(not applicable when Zoomed to Editor View) |
|
Left Arrow |
Decrease Column width (not applicable when
Zoomed to Editor View) |
|
Right Arrow |
Increase Column Width (not applicable when
Zoomed to Editor View) |
|
+ |
Zoom In by shrinking Visualizer box height |
|
- |
Zoom Out by increase Visualizer box height |
|
Space |
Match row width to editor width (not applicable
when Zoomed to Editor View) |
|
F5 |
Refresh the Data Visualizer by forcing a repaint |